
Traditional resumes and LinkedIn profiles often fail to capture the full breadth of a person’s knowledge and expertise, as they primarily focus on formal education and professional experiences. In reality, professionals today continuously acquire new skills and knowledge in various domains outside the confines of academic institutions or workplaces. To better represent an individual’s skills and expertise, I propose creating a knowledge graph that tracks and categorizes their interests and activities.
Individuals engage in numerous activities to enhance their knowledge and skills, such as:
- Exploring emerging fields such as cryptocurrency, learning new programming languages, and gaining professional skills in engineering, finance, or product management.
- Gaining proficiency in new software tools like Photoshop or no-code Bubble.io.
- Exploring novel sectors and pursuing unique interests in areas such as politics, real estate, or beekeeping.
- Pursuing diverse extra-curricular activities, such as learning new languages, musical instruments, sports, or historical literature.
- Acquiring life skills outside their professional realm, such as navigating motherhood or the immigration process in a new country.
These learning experiences often occur through personal endeavors, including after-work hours, hackathons, online communities, and in-person meetups. Such expertise can significantly enhance a person’s career and personal connections. However, there are currently no comprehensive tools available to showcase an individual’s complete range of knowledge and skills.
One possible solution is to create a knowledge graph based on time spent on various activities, utilizing a Chrome plugin that tracks users’ online reading and viewing activities. The plugin would automatically categorize and update the knowledge graph without requiring manual input. Glasp founder Kazuki Nakayashiki has demonstrated this concept in the creation of his personal knowledge graph.
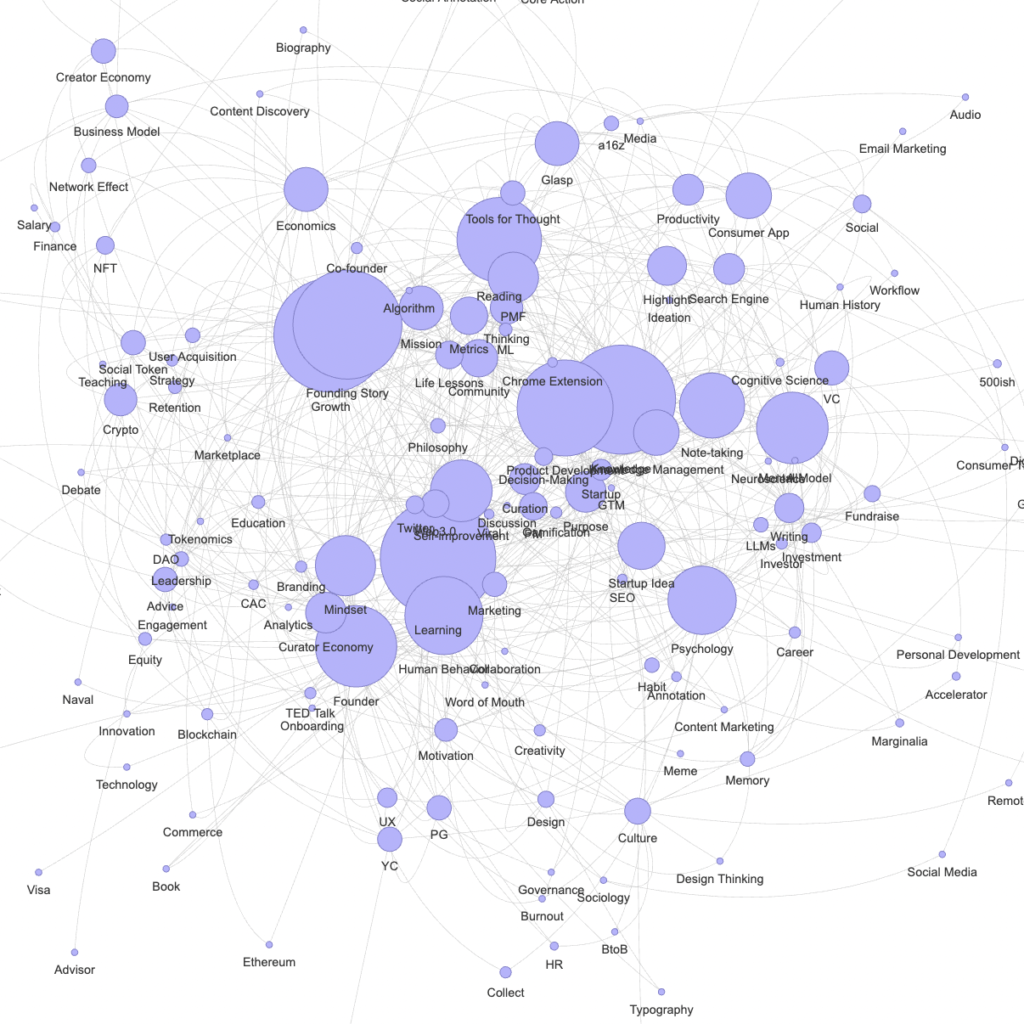
Implementation:
Creating a knowledge graph involves several stages, including data collection, content categorization, graph construction, and visualization.
- Data Collection: Develop a Chrome plugin that tracks users’ online activities, such as reading, watching, or using task-specific software and websites. While using time spent online as a proxy for expertise is not perfect, it serves as a viable starting point.
- Content Categorization: Employ natural language processing (NLP) tools like GPT-based models to classify and organize information, including categorizing web pages, videos, and software usage into relevant topics and extracting key concepts from text or video content.
- Graph Construction: Use graph databases, such as Neo4j, to store categorized data as nodes and edges in the graph. Nodes represent topics, concepts, or skills, while edges represent relationships between them, such as “learned from” or “applied in.” Additional attributes, like timestamps and time spent on each topic, can be stored as node or edge properties.
- Decay Factor: Introduce a decay factor using a time-based function (e.g., exponential decay) to reduce the weight of older topics or skills over time, ensuring the graph remains current with the user’s evolving interests and expertise.
Visualization:
Develop an interactive front-end application utilizing graph visualization libraries like D3.js, Vis.js, or Sigma.js to present the knowledge graph in two views:
- Cumulative view (default): Displays a person’s consolidated knowledge/skills since inception, combining past and present skill sets. A decay factor can be introduced over time to account for diminishing knowledge in topics not revisited.
- Timeline view: Illustrates the evolution of a person’s interests and knowledge on a month-by-month basis. A timeline slider allows viewers to observe changes in focus over time, with circle sizes on the graph corresponding to time spent on a topic in a given month.
Users can also toggle between a normalized view (displaying the proportion of time spent on a topic per day or month) and an absolute view (default, displaying circles proportional to the total time data available for an individual).
In conclusion, knowledge graphs offer a more comprehensive representation of an individual’s skills and expertise, accounting for learning experiences that extend beyond traditional resumes and LinkedIn profiles. By developing tools that track and categorize a person’s interests, we can effectively showcase the full extent of their knowledge and capabilities.
If you find this idea intriguing and are interested in collaborating to bring this product to market, please feel free to reach out.